AAM Viewpoints — The Bull Market Turns Three…Where it Ranks, and Can it Last?
Where it Ranks
Last week marked the three-year anniversary of the current bull market since the October 2022 lows. The S&P 500 has gained over 90% (total return) over the period; an impressive, annualized return of approximately 25%. To put that in perspective, looking at monthly returns over the last 30 years, the three-year period ending September 2025 ranks in the 91st percentile.
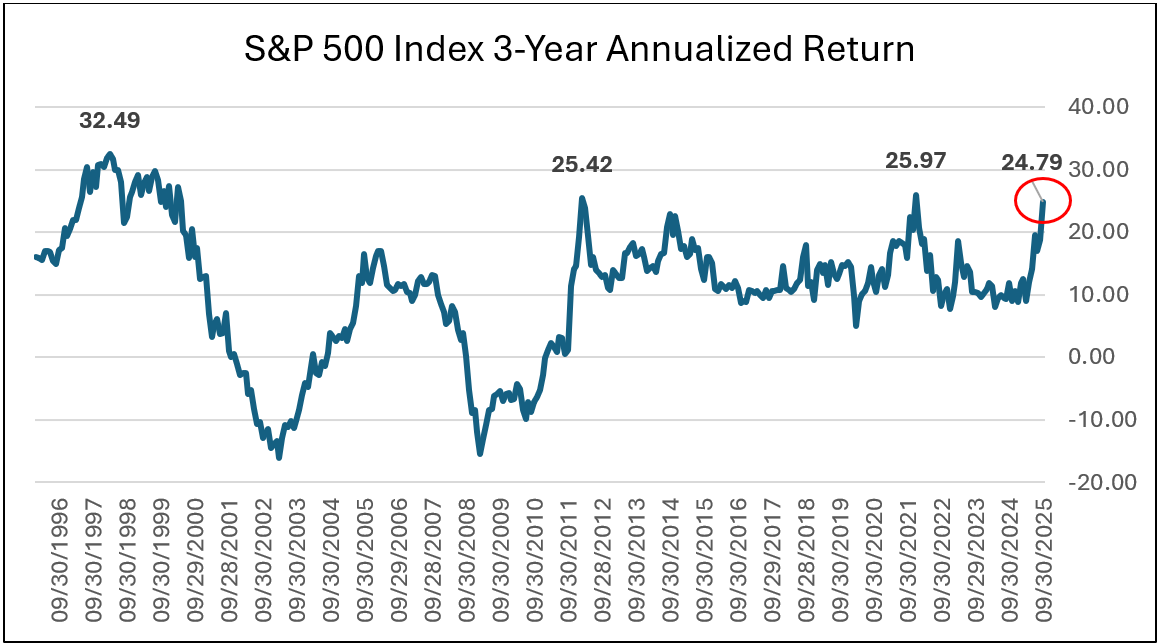
Source: FactSet, AAM | Past performance is not indicative of future results.
The only periods to see similar, three-year annualized returns were during the bull run of the late 1990s, following the Great Financial Crisis, and following Covid.
Average Bull Market
Going back to 1950, the average bull market lasts about five years with an average gain of 191%. More specifically, looking at the last five bull market cycles the average gain jumps to 285% over seven years, suggesting modern bull markets have become longer and stronger than older historical comparisons.
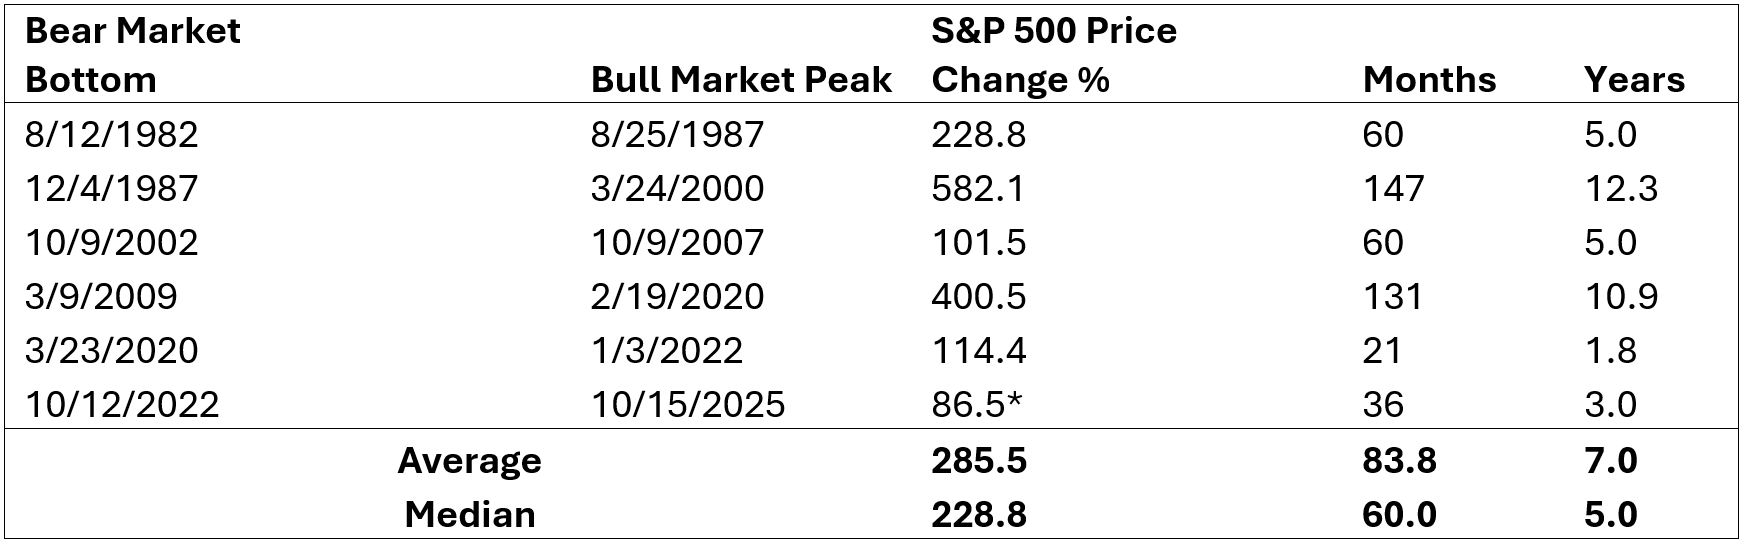
*Current cycle is active and excluded from averages. Source: FactSet, AAM | Past performance is not indicative of future results.
Of course, no one knows when a bull market will end. However, the current cycle is relatively young in terms of both duration and magnitude compared to recent expansions.
Can It Last?
The bull market has pushed U.S. equities to record levels. The S&P 500 closed at a record high 57 times in 2024 and 33 times year-to-date. Ironically, this can become an impediment to portfolio returns as investors hesitate. Contrary to the popular notion of “buy low, sell high,” putting money to work when the market is at record highs has proven to be a productive strategy. Analysis from BofA Global Research shows higher returns one , two, and five years later when buying the S&P 500 at highs verse all other periods.
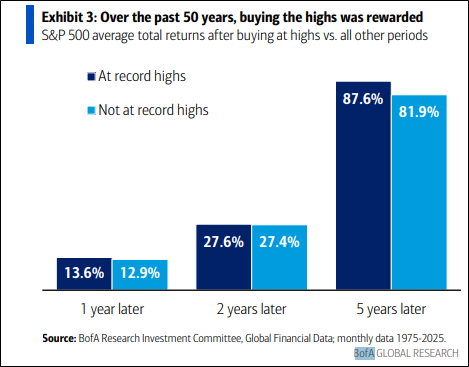
Past performance is not indicative of future results.
Momentum can be powerful. Historical returns suggest that during a bull market accompanied by record highs such as the current environment, a “buy high, sell higher” approach may be reasonable.
Conclusion
A quick moment of appreciation for one of the strongest three-year runs we have seen in the last 30 years. As we enter year four, there is precedent for the market to continue to advance when compared to bull market averages. Perhaps counterintuitively, buying the S&P 500 at the highs has increased forward returns. For those who believe they have missed the boat, or are uncertain of putting money to work with equities at record levels, Peter Lynch put it best: “Far more money has been lost by investors in preparing for corrections, or anticipating corrections, than has been lost in the corrections themselves.”
CRN: 2025-1003-12902 R
Disclosures
This commentary is provided for information purposes only and does not pertain to any fixed income security product or service and is not an offer or solicitation of an offer to buy or sell any product or service. Unless otherwise stated, all information and opinion contained in this publication were produced by Advisors Asset Management, Inc ('AAM') and other sources believed by AAM to be accurate and reliable. Due to rapidly changing market conditions and the complexity of investment decisions, supplemental information and other sources may be required to make informed investment decisions based on your individual investment objectives and suitability specifications. All expressions of opinions are subject to change without notice.
All AAM employees, including research associates, receive compensation that is based in part upon the overall performance of the firm. AAM may make a market in or have other financial interests in any given security with which this analysis suggests may be benefited from its conclusions. Investors should seek financial advice regarding the appropriateness of investing in any security or investment strategy discussed or recommended in this report and should understand that statements regarding future prospects may not be realized. Past performance does not guarantee future performance.
All content on this Site is presented only as of the date published or indicated, and may be superseded by subsequent market events or for other reasons. In addition, you are responsible for setting the cache settings on your browser to ensure you are receiving the most recent data.
Chart/Graph Disclosure
The chart and/or graph does not reflect past or current recommendations made by Advisors Asset Management, Inc. (AAM), and should be considered an academic treatment of empirical data. It is designed for educational purposes only and should not be used to predict security prices or market levels. Any suggestion of cause and effect or of the predictability of economic or investment cycles is unintentional. This report should only be considered as a tool in any broker, dealer, or advisors investment decision matrix. Investors should consult their financial advisor when applying the assumptions of the chart or graph.
For more commentary and market insights, visit the AAM Live Commentary at www.aamlive.com/blog